

Introduction
Modern businesses and students depend on advanced applications such as Power BI for data Analyze and visualization. The tool has become extremely popular with data analysts, professionals, and students because it enables them to transform raw data into useful insights
Power BI surely delivers an interactive environment which enables users to attach data sources together, modify datasets, generate dynamic visual representations, and produce analytical reports that improve decision-making capabilities. Students and professionals should use Power BI as a tool to improve their analytical expertise while achieving business success.
What makes Power BI indispensable for data analysis?
Power BI stands as a leading business intelligence software which further empowers users to:
- Users can further establish connections to different data sources including Excel files, SQL databases, cloud platforms, and APIs for analysis purposes.
- Build visually striking reports and dashboards that surely help users make better decisions.
- Employ AI analytics tools to discover patterns and forecast results while automating data tasks.
- Teams and also stakeholders gain access to insights as they happen through Power BI features.
- Undoubtedly, automating your repetitive data analysis processes will achieve greater efficiency.
Power BI enables both students and enterprises to strengthen their data management skills while advancing their analytical abilities.
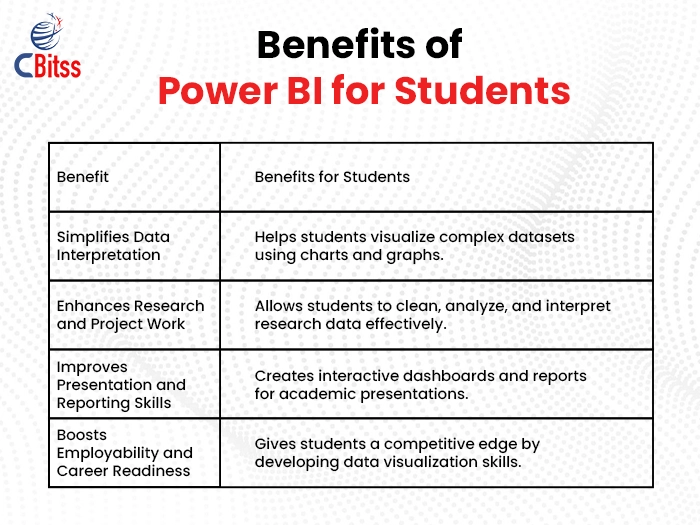
What Are the Advantages of Power BI for Students During Their Academic Work?
1. Simplifies Data Interpretation
During research or project work, students regularly work with extensive datasets. Power BI enables users to manage overall complex data more easily by representing it through visual formats including graphs, charts, and tables.
2. Enhances Research and Project Work
- Students can use Power BI to import data and then easily clean and transform it.
- The tool helps them discover patterns and trends also within their research data.
- AI-driven analytics empower students to reach data-backed conclusions undoubtedly.
3. Improves Presentation and Reporting Skills
- Students can develop interactive dashboards for presentations through the capabilities of Power BI.
- Through Power BI students can craft visually appealing reports that highlight their work effectiveness.
- This tool reduces complexity in statistical analysis, which leads to more insightful reports.
4. Boosts Employability and Career Readiness
- Students who learn Power BI gain a competitive advantage when entering job markets.
- Employers often seek candidates who possess expertise in data visualization and analytical abilities.
- Students who master Power BI will find high-paying job opportunities available to them.
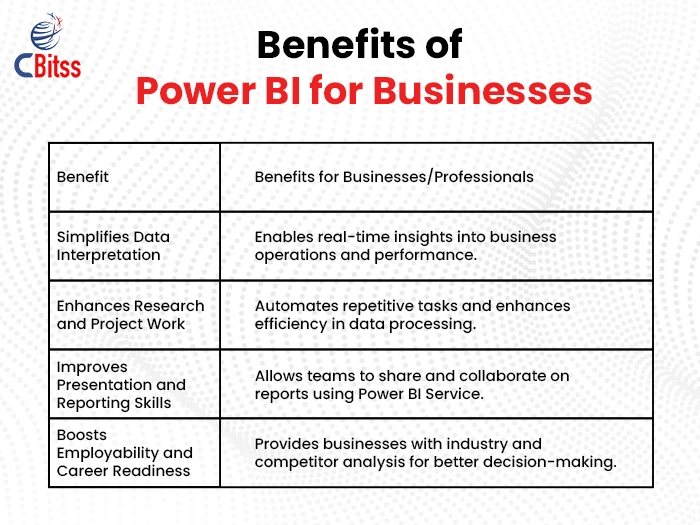
How Power BI Benefits Professionals and Businesses and Students?
1. Improves Business Decision-Making
Power BI enables professionals to examine business performance metrics along with sales data and customer behavior patterns together with operational information. Real-time dashboards help decision-makers develop informed business strategies.
2. Enhances Productivity and Efficiency
- Power BI eliminates repetitive manual tasks through automation.
- Businesses have the ability to track their key performance indicators (KPIs) through effective monitoring systems.
- AI-powered analytic tools forecast upcoming trends to improve planning processes.
3. Enables Collaboration and Data Sharing
- Teams gain seamless report-sharing capabilities through Power BI’s cloud-based service.
- Power BI enables organizations to unify their data, which leads to improved team collaboration.
- Professionals are able to access reports whenever and wherever they need them.
4. Helps in Market and Competitor Analysis
- Power BI enables professionals to monitor industry trends and assess competitor strategies.
- Power BI assists businesses in analyzing customer preferences to develop superior marketing strategies.
How Data Analysts Use Power BI?
1. Data Collection and Transformation
Power BI enables data analysts to connect various data sources for analytical purposes.
Power Query enables data analysts to refine raw data and convert it into valuable insights.
2. Data Visualization and Dashboard Creation
Through the creation of interactive dashboards, data analysts present essential business performance metrics.
The ability to make data-driven decisions quickly becomes available to executives and stakeholders because of this capability.
3. Advanced Analytics with AI and DAX
AI-powered tools in Power BI enable data analysts to predict trends and spot anomalies.
DAX (Data Analysis Expressions) enables data analysts to conduct their calculations with efficient performance.
4. Reporting and Decision Support
Data analysts produce detailed reports which encapsulate key findings.
Through their actions organizations experience enhanced business processes and bigger profit margins.
Guide to Performing Data Analysis and Visualization using Power BI
1. Connect Data Sources
Power BI enables users to bring data from Excel spreadsheets along with SQL databases, SharePoint sites, Google Analytics reports and cloud-based platforms into their analysis.
Power BI supports several file formats which provides users with the ability to perform flexible data analysis.
2. Transform Data Using Power Query
Power BI offers Power Query Editor which enables users to clean and transform datasets.
Through Power BI users have the ability to eliminate duplicate records manage missing data elements as well as organize their datasets.
3. Create Relationships Between Data Tables
Data modeling enables users to establish links between various tables.
Power BI streamlines data connection processes by automatically establishing relationships.
4. Build Visualizations and Dashboards
Users can transfer bar charts, line graphs, pie charts as well as heatmaps through drag-and-drop actions.
Users generate engaging reports that emphasize key findings through this process.
5. Share Reports and Collaborate
Through Power BI Service professionals can distribute their reports on the internet.
Businesses, moreover, can integrate Power BI dashboards seamlessly into Microsoft Teams, SharePoint, as well as Power Apps platforms.
Explore methods to create impactful Power BI reports and dashboards
- Choose the Right Visualization: Choose visualization types that appropriately represent your data.
- Use Color Coding and Labels: Ensure clarity in reports to improve readability.
- Apply Filters and Slicers: Allow users to interact with reports dynamically.
- Maintain a Logical Layout: Always position critical graphics on top to maximize visibility.
- Optimize for Mobile Devices: Ensure dashboards are responsive for mobile users.
Future of Data Analysis and Power BI
Power BI evolves through the incorporation of AI capabilities and also machine learning integration. The adoption of Power BI by businesses and professionals provides them with enhanced operational insights. Skilled Power BI users will see growing demand across various sectors because of these insights.
Final Thought
Furthermore, Power BI stands as an indispensable tool across student, professional, and business domains. Professionals in fact, who learn Power BI will develop stronger analytical skills, which leads to better career opportunities.
Through Power BI students can streamline their research processes, develop better reports, and strengthen their career potential.
Through Power BI professionals gain the ability to improve decision-making processes while automating tasks that ultimately lead to increased productivity.
Data analysts have the ability to derive valuable insights from data while creating dashboards and aiding in company expansion.
Anyone who wants to become a top performer in data analysis and business intelligence further should master Power BI. Firstly, mastering Power BI right now to access unlimited opportunities within the data realm!